



Overview
The Performance view in Nosmai Studio reports what a filter costs. It has three bands: a summary verdict per resource, a by-layer breakdown of what each authored piece costs, and live engine timing while the preview runs. Warnings are guidance, not gates: you can always export.
Product: Nosmai Studio · Platform: macOS, Windows · Updated: 6 October 2026 · Reading time: 7 minutes
Prerequisites
- A project open in the editor.
- For the live timing band, a running preview.
Open it
Open Performance in the stage view switcher. The summary and by-layer bands appear straight away from the filter's files. The live timing band fills in once you start the preview.
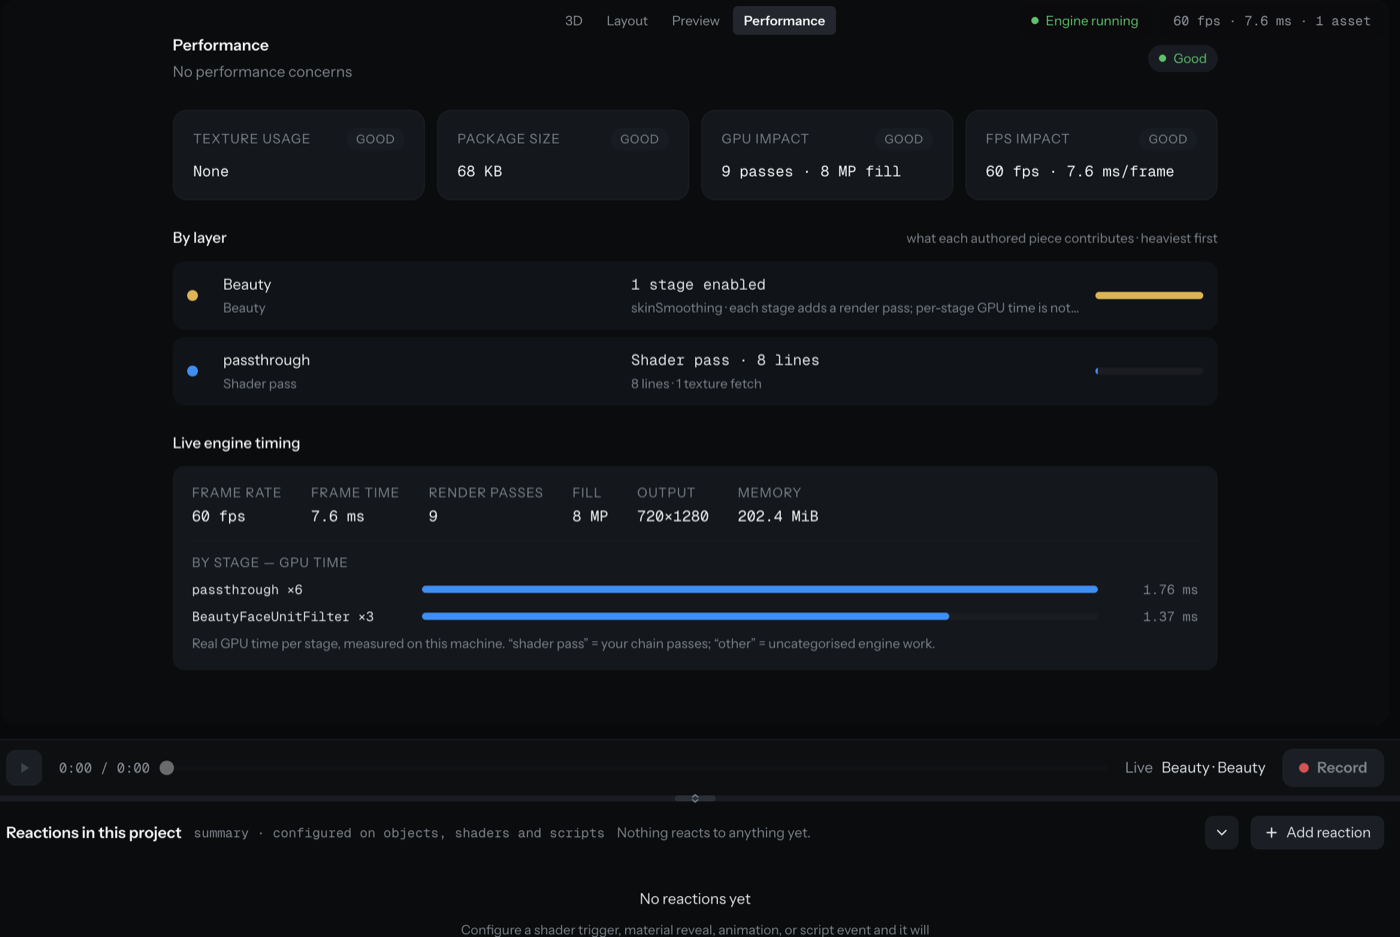
The summary
Each resource gets a verdict of Good, Warning, or High:
- Texture usage: how many textures, their largest edge, and their memory.
- 3D geometry: models and total triangles.
- Package size: the exported bytes.
- GPU impact and FPS impact: measured, so they read "Run the preview to measure" until the preview runs.
The thresholds are tuned for a mid-range phone, because a filter authored on a desktop still has to run on a phone.
By layer
The by-layer band lists each authored piece (each shader pass, 3D model, texture, the beauty block, the background) ranked heaviest first, with what it costs. This is where you see which part of the filter is the expensive one.
Live engine timing
While the preview runs, this band shows the measured frame rate, frame time, render passes, fill, output resolution, and memory. When the GPU supports it, it also shows GPU time per layer (for example a named shader pass in milliseconds), so you can see exactly where a frame goes. If per-layer GPU timing is not available, it falls back to a fill-based ranking and says so.
Act on a warning
The What to look at list gives each problem a cause, a likely impact, and a "Try" suggestion. Common fixes:
- Resize a texture whose longest edge is very large.
- Decimate a model with a high triangle count.
- Reduce the number of full-frame shader passes.
None of this blocks export. It is there so a filter runs well on a device.
Verify it worked
- The summary cards show a verdict for each resource.
- The by-layer list ranks the filter's pieces by cost.
- With the preview running, the live band shows a real frame rate and, where supported, GPU time per layer.
Common problems
| What you see | Why | Fix |
|---|---|---|
| GPU impact and FPS say "Run the preview to measure" | They are measured, and the preview is not running | Start the preview, then return to Performance |
| A texture shows "size unknown" | The project does not record that texture's dimensions and its bytes are not in memory | Re-import the texture, or open it so Studio can read its size |
| The live band shows fill instead of GPU time per layer | The GPU reported its timer as unavailable or unreliable this frame | Use the fill ranking; it still orders passes by cost |
| A filter is marked High | A resource is over the mobile threshold | Follow the "Try" suggestion for that resource; export still works |
